Monitor the performance of your Amazon RDS instances with cascading replication
Mastering the Overview of Cascaded RDS Instances: A Guide to Efficient Monitoring
Amazon RDS supports from version 14 of PostgreSQL cascading replication, up to 155 read replicas. Cf Amazon announcement
This solution can be very interesting for intensive reading applications.
Consequently, on this type of architecture, a vision of the activity by cluster is insufficient. It becomes essential to have a global vision with the possibility of drilling-down.
This is what Datasentinel natively allows, thus facilitating the analysis of the performance of particular processing operations, the identification of problematic sessions and/or queries on all of your clusters (primary + read replicas) or on a particular instance.
Not storing data on the monitored clusters, Datasentinel can thus connect to any type of cluster, including those in standby/read-only mode
Datasentinel can also monitor Amazon Aurora PostgreSQL instances
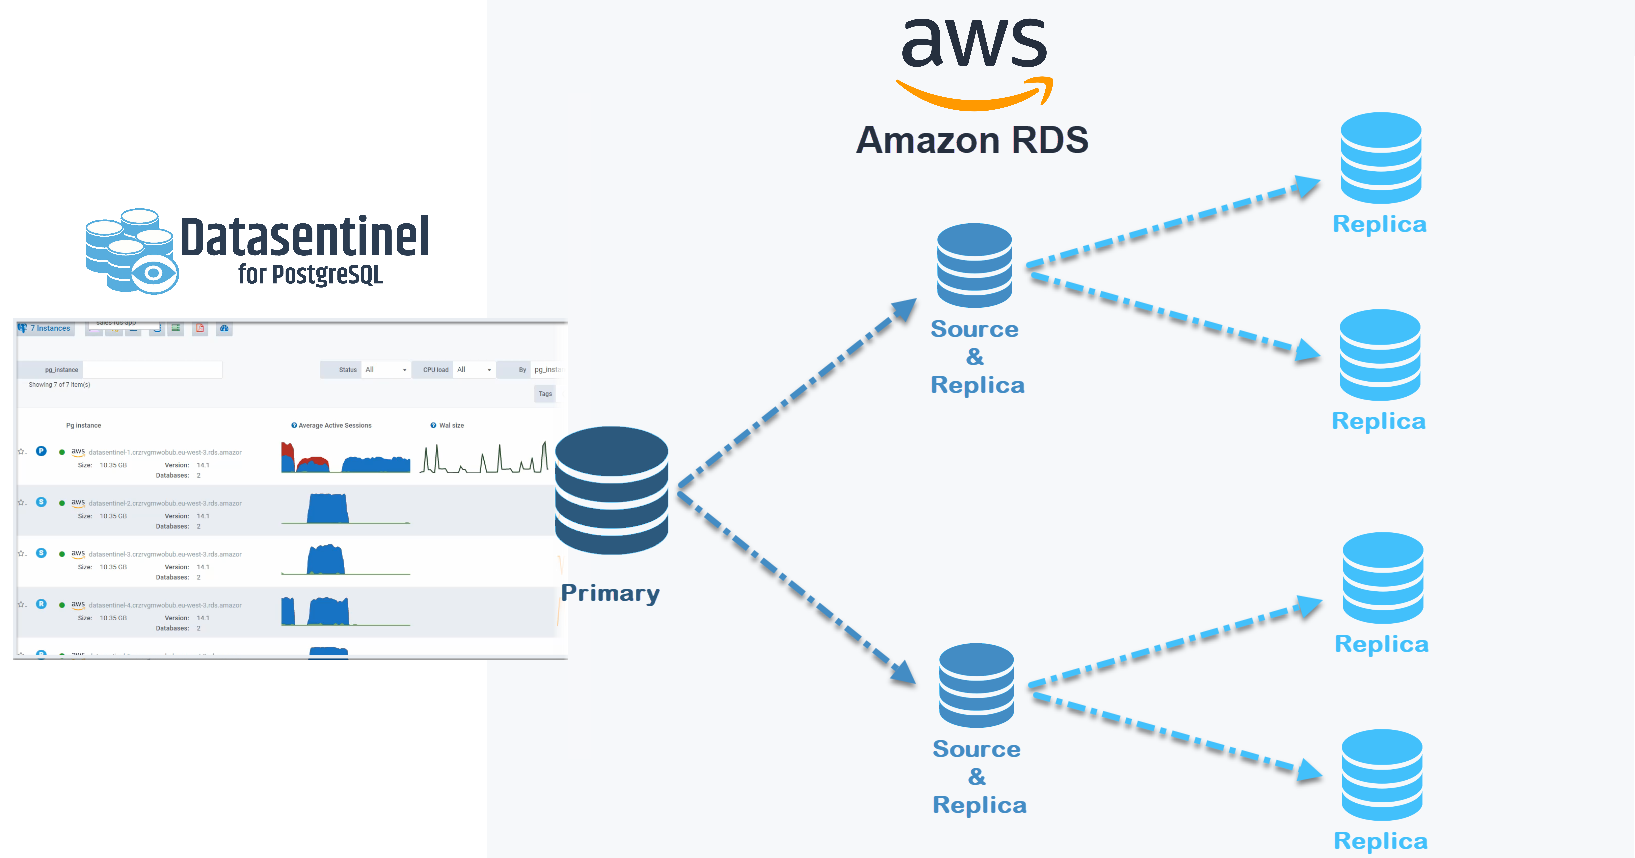
Discover how to seamlessly configure Datasentinel monitoring for intricate database architectures.
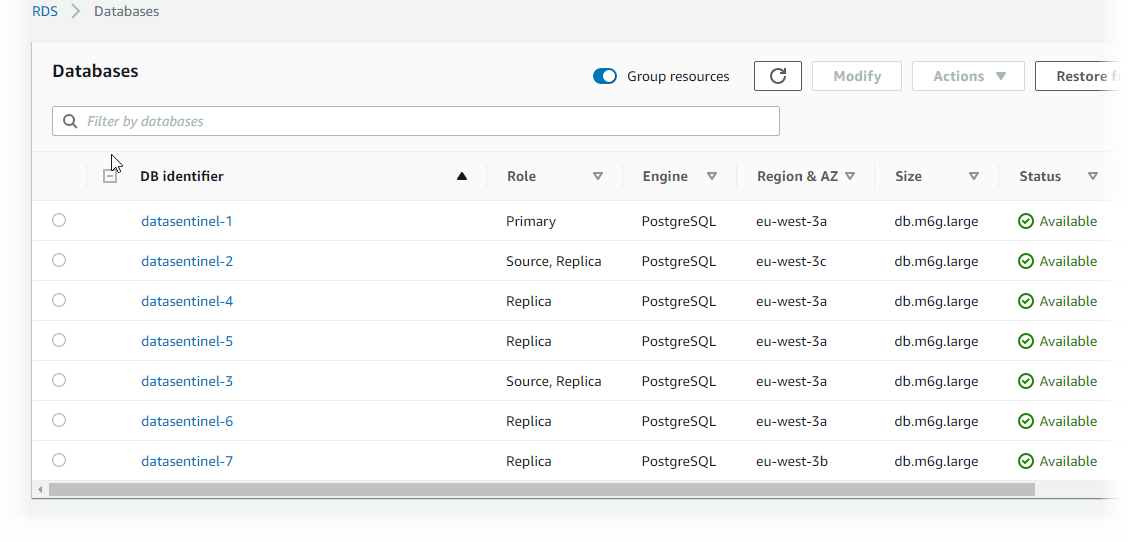
Our walkthrough focuses on a multi-tiered replication setup featuring 2 intermediate replicas and 4 second-level replicas—making it a robust 7-cluster configuration with one primary and six read replicas.
The AWS RDS console therefore indicates 7 instances:
Load-balancing reads to multiple Amazon RDS instances is done by using Amazon Route 53.
Pgbench is used for the benchmark with 2 sets of tests: 1 read/write + 1 read only
The pg_stat_statements extension is installed in the postgres database and the pg_stat_statements.track parameter is set to all on all clusters
Datasentinel Configuration
First, it is necessary to have a Datasentinel platform available.
Many solutions:
1 - Deployment from AWS Marketplace
2 - Provision of a platform in SaaS mode by Datasentinel.
3 - On-premises installation.
Then, configure each cluster in direct connection
2 possibilities:
- Configure a local agent on an intermediate server with access to all clusters.
A single agent can monitor multiple instances. (Refer to Agent Installation guide)
or
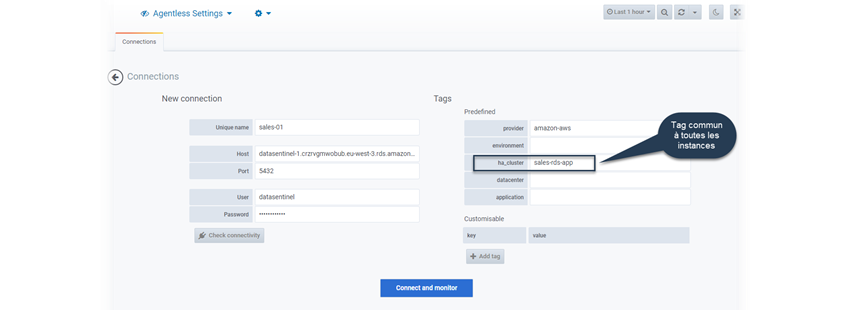
- Set up a connection for each cluster using the AgentLess method, directly from the platform UI or via the API
It is important to specify a common property (a TAG) to the instances (cf How to use TAGs efficiently) allowing them to be uniquely identified
In this tutorial, the Tag ha_cluster is chosen to identify the clusters. Each instance will therefore be assigned the tag ha_cluster=sales-rds-app
Configuration example in AgentLess mode
Architecture visualization
Find the 7-instance architecture on the home page and their current workload by applying the filter ha_cluster=sales-rds-app
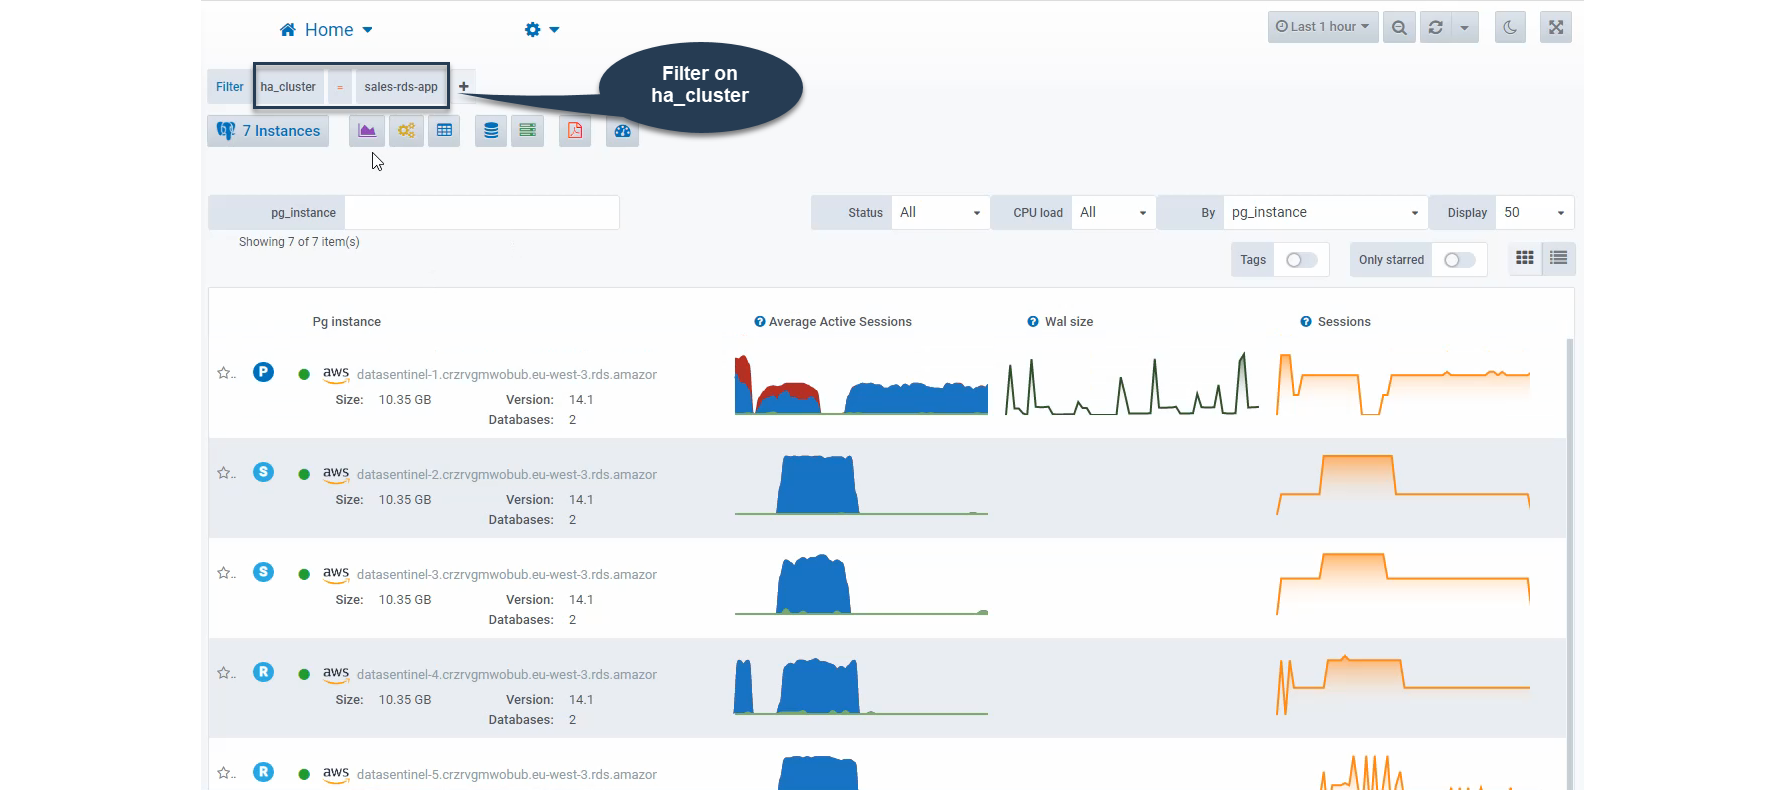
You find the 7 instances: P -> Primary, S -> Source, Replica, R -> replica.
Exploring the consolidated activity of your instances
Modules Session History,
Top Queries
and
Top Tables & Indexes allow a consolidated or detailed vision by instance.
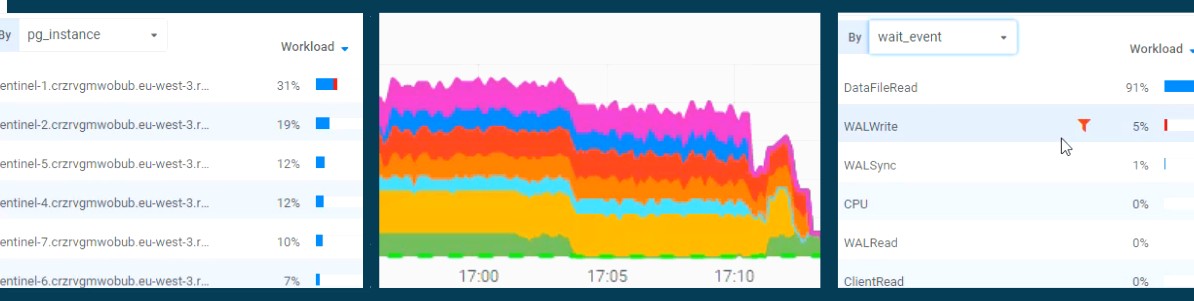
The Session History module allows you to visualize at a glance the overall activity of our architecture as well as the queries and/or sessions having the greatest impact
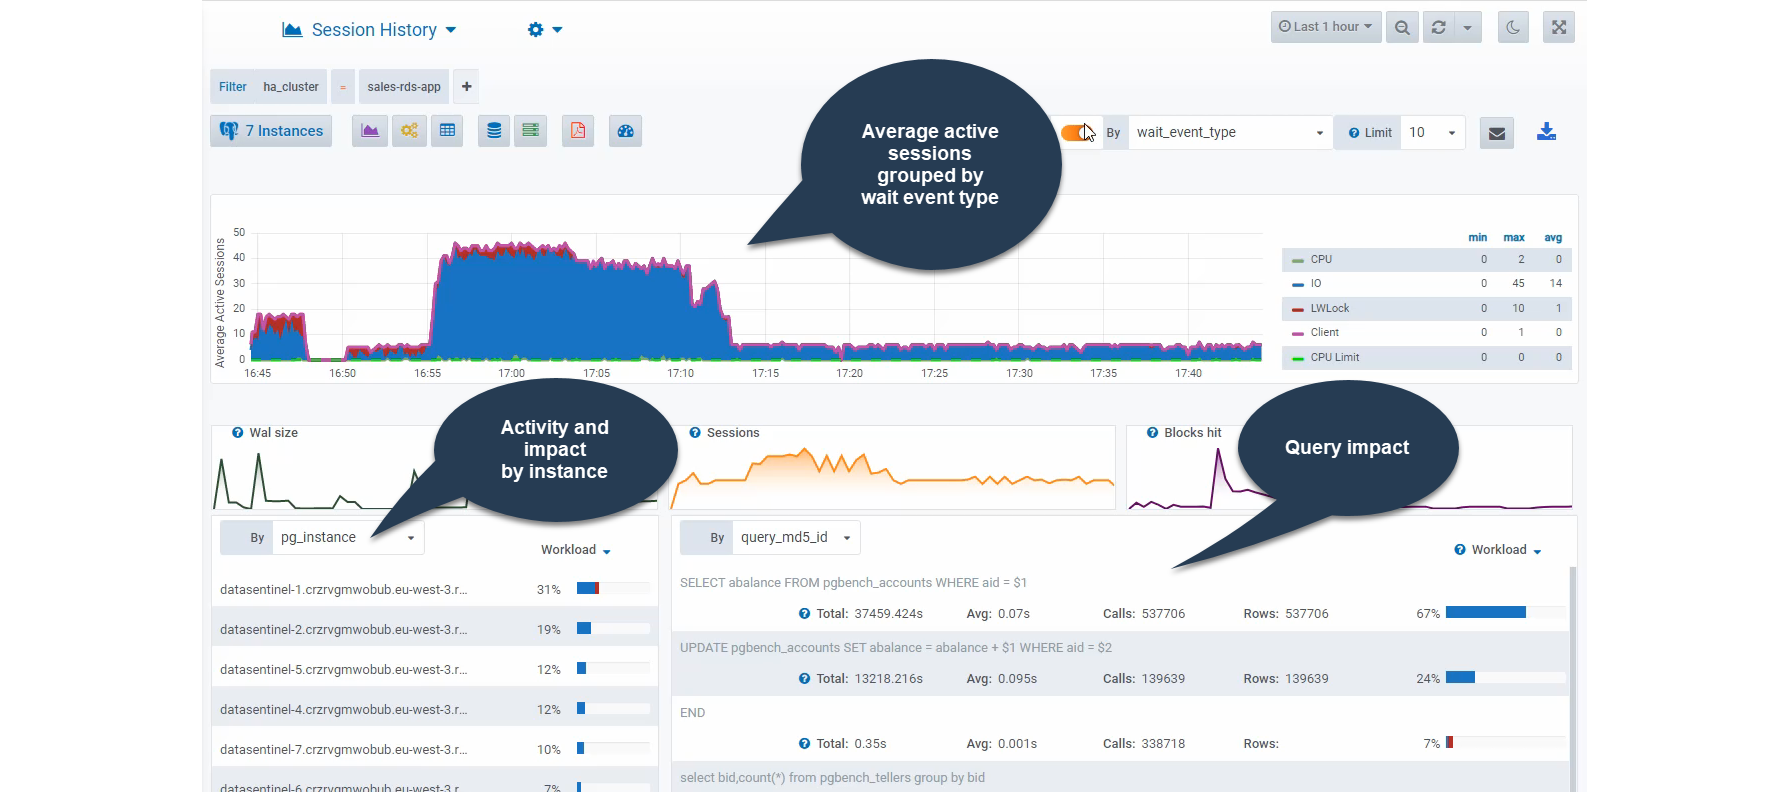
The module offers many possibilities for viewing activity, filtered by instance or consolidated, with different grouping criteria and possibility to choose its time range. Datasentinel can log several months of activity.
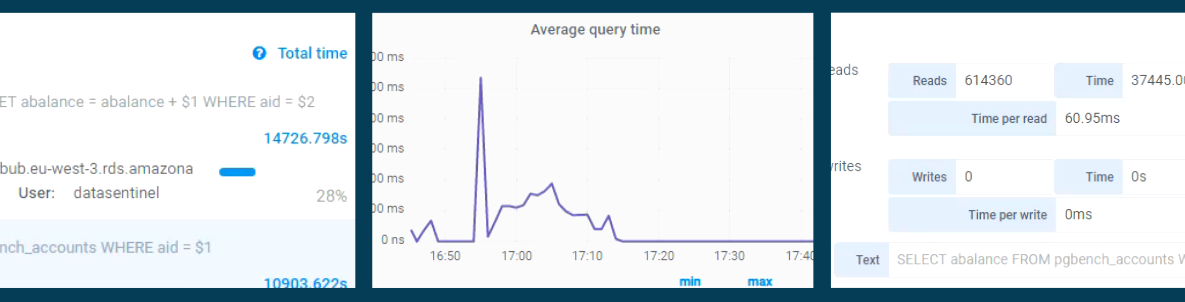
The Top Queries module, utilizing metrics from the pg_stat_statements extension, enables quick identification of the most resource-intensive queries based on specific dimensions.
For example, find the queries requiring the most disk reads or those having a high execution time. etc… with the possibility of drilling-down on a particular query.
On the same principle, it is possible to list the Top Tables & indexes on a particular dimension (disk reads, cache access, etc.).
But also
Datasentinel collects global metrics for each cluster and database, available on various dashboards and also allows you to connect in Real Time on each instance
The Reporting module allows you to generate several types of activity reports for all instances or a particular one.
Datasentinel is compatible with all public cloud providers offering PostgreSQL managed cluster solutions,
allowing centralized monitoring in a multi-cloud or hybrid environment and thus having a single solution
Conclusion
Datasentinel enables performance monitoring of your most critical PostgreSQL RDS Amazon instances with precision.
Datasentinel unique features and the simplexity of its GUI allow a quick start to easily and precisely analyze the workload of all your Postgres instances
Do not hesitate to contact us at contact@datasentinel.io to learn more about the many possibilities of our solution
Stay connected!