How to Use Bash to Get PostgreSQL Performance Report
Bash can help us call Datasentinel reporting APIs , which makes it easy to analyze PostgreSQL performance and find ways to improve it.
We’ve seen how to integrate Datasentinel reporting feature with ChatGPT using Python.
Today, we will explore how we can create one bash script that can export a PostgreSQL report for your database instances.
This report should give you useful information and help improve how well PostgreSQL databases work as a whole.
In this technical guide, you will create Datasentinel API endpoints using curl until you get the top queries report using the Reporting API.
You’ll also create a shell script to do all the steps, starting from the agent start until downloading the report.
Starting the Datasentinel agent
Assuming you already have the datasentinel agent installed on your machine, you can start the agent now with the following command:
datasentinel start agentYou’ll get a response as follows:
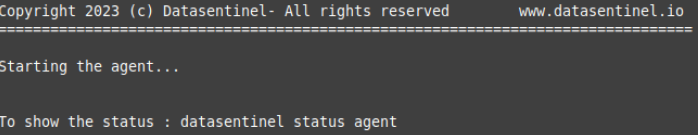
As you can see, the agent is starting, and you can take a look at the status with the following command:
datasentinel status agentIf the Datasentinel agent is running successfully, you’ll get a breakdown about your agent; like the server name, port number, upload host name, etc.
Before we create the reporting API, we need to check a few configurations regarding the Datasentinel platform.
Consult the documentation for guidance on utilizing the Agent CLI .
Checking the server information
We need to make sure that our Datasentinel platform is running by fetching its server name and port number.
To do that, you can write the following CURL command:
$ BASE_URL=https://localhost:8282
$ curl -k -X GET $BASE_URL/api/server
The command above is a CURL command that retrieves server information from Datasentinel.
It sends a GET request to the Datasentinel API endpoint /api/server using the provided BASE_URL variable.
The response contains the hostname and port of the server, like the following:
{
  "host": "<your-datasentinel-platform-server>",
  "port": 443
}
Consult the documentation for guidance on utilizing the Agent API .
Adding a Datasentinel connection to PostgreSQL
Now, you’re ready to add a connection to a PostgreSQL database:
$ export DATASENTINEL_TOKEN=<<datasentinel_token>>
$ CONNECTION_NAME=mydb
$ curl -k --header "api-token: $DATASENTINEL_TOKEN" \
       --header 'Content-Type: application/json' \
       --request POST "$BASE_URL/api/connections/$CONNECTION_NAME" \
       -d @body.json
where body.json is:
{
    "host": "localhost",
    "port": 5432,
    "user": "<your-database-username>",
    "password": "<your-database-password>",
    "tags": "application=application_name,environment=application_type,datacenter=datacenter"
}
Datasentinel Reporting API
Now, we’re ready to communicate with the Reporting APIs after starting the datasentinel agent and making sure we get the server information.
Generating the user token
We use the datasentinel token in API calls that need authentication. To send requests to Reporting APIs, you need to use a user-specific token that expires one day after you generate it. This token is called a user token.
Consult the appropriate documentation to Acquire an Access Token using the Platform API .
To generate this user token, you can write the following command:
$ export DATASENTINEL_PLATFORM_SERVER=https://<your-datasentinel-platform-host>
$ export DATASENTINEL_USER=<your-datasentinel-username>
$ export DATASENTINEL_PWD=<your-datasentinel-password>
$ curl -u $DATASENTINEL_USER:$DATASENTINEL_PWD -k -X POST $DATASENTINEL_PLATFORM_SERVER/ds-api/user-token
The CURL command above sends an HTTP POST request to generate a user token in Datasentinel.
The POST request (defined right after the -X option) combines the DATASENTINEL_PLATFORM_SERVER environment variable with the /ds-api/user-token path. The DATASENTINEL_PLATFORM_SERVER env var represents the server address or base URL of the Datasentinel platform sent to you in the initial Datasentinel free trial email.
The -u option value is used to provide authentication credentials separated by a colon. This is used for basic authentication, where DATASENTINEL_USER and DATASENTINEL_PWD represent the username and password for the Datasentinel user.
You can find both credentials in the initial email that Datasentinel sent you when you first signed up for the Datasentinel platform.
The output response will look like this:
{
  "user-token": "<your-datasentinel-user-token>"
}
You can save
export DATASENTINEL_USER_TOKEN=<your-datasentinel-user-token>You’ll need this token.
This token is different from the datasentinel token we used previously.
Checking the user token
You can display useful information about the user token using the following command:
curl -u $DATASENTINEL_USER:$DATASENTINEL_PWD -k -X GET $DATASENTINEL_PLATFORM_SERVER/ds-api/user-token?token=$DATASENTINEL_USER_TOKENWe construct the URL for the GET request by combining the DATASENTINEL_PLATFORM_SERVER env variable, /ds-api/user-token, and the query parameter that contains the user token we just generated: token={$DATASENTINEL_USER_TOKEN}.
The response contains a JSON like the following:
{
  "organization_name": "<organization-name>",
  "email": "contact@datasentinel.io",
  "user": "<user-name>",
  "expire_time": "2023-07-19 08:34:55"
}
As you can see, these parameters are related to your personal account on the Datasentinel platform, including the expiration date of the user token. It turns out it expires one day after we generated it, as mentioned above.
Benchmarking PostgreSQL performance with pgbench
To get insights from the report, we need to simulate some workload in a specific database. If you have a workload already in the database that you connected, you can skip this section.
We will use the pgbench tool which is a simple program to run benchmark tests on a PostgreSQL database.
By default, it involves five SELECT, UPDATE, and INSERT commands per transaction.
To use this program, we will first create a new database:
sudo -u postgres psql -c "CREATE DATABASE plans;"And then initiate pgbench with the -i option and then the database that we’ve just created: (feel free to place a database other than plans)
sudo -u postgres pgbench -i plansTo run the pgbench program, you can use the pgbench command with the options as in the pgbench documentation
sudo -u postgres pgbench -c10 -t300 plansIn this example, we’ve used the -c option with 10 to indicate that we need 10 clients to simulate running the queries which indicate the number of database sessions. Additionally, specifying the -t option with 300 value indicates that there are 300 transactions run by each client.
Downloading the Datasentinel report
You can consult the Reporting Feature’s Documentation for comprehensive details.
By navigating through the Datasentinel Reporting API page , you’ll see different endpoints that you can send requests to.
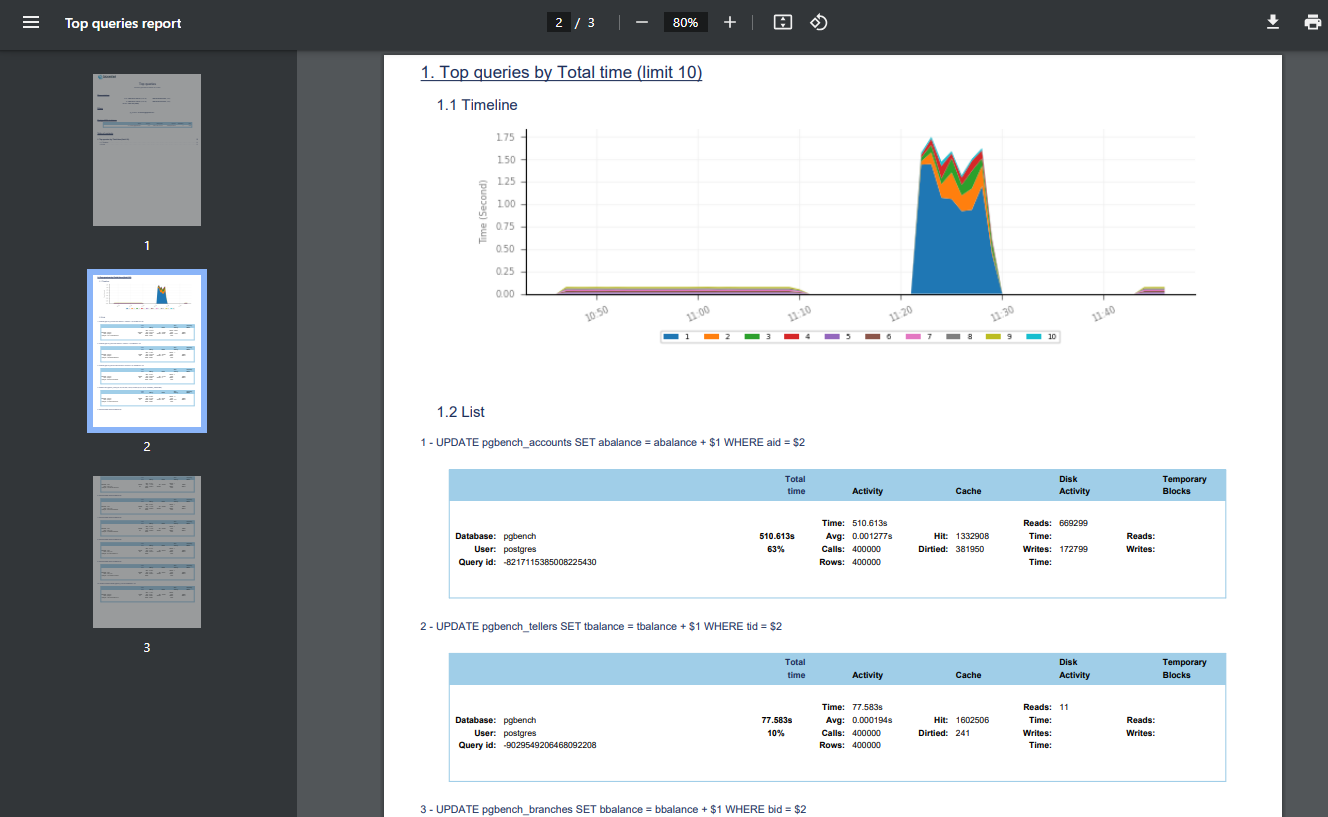
In this guide, you’ll send a request to the top queries endpoint.
Now, let’s call the top queries API with the following CURL command to download the top queries report:
curl -k --header "user-token: $DATASENTINEL_USER_TOKEN" \
     --header 'Content-Type: application/json' \
     --request POST "$DATASENTINEL_PLATFORM_SERVER/ds-api/activity/top-queries-report" \
     -d @report.json -o top-queries.pdf
The command above handles a POST request to a Datasentinel Reporting API endpoint.
It is constructed using the DATASENTINEL_PLATFORM_SERVER environment variable and the following Datasentinel top queries report endpoint /ds-api/activity/top-queries-report.
This is the part that you will change whenever you communicate with other Reporting APIs listed here .
The values of the –header option contain the request headers, with the user-token header set to the DATASENTINEL_USER_TOKEN variable value, and the Content-Type set to application/json.
The value of the -d option is the report specification JSON that represents the payload of the POST request:
{
    "utc_time": false,
    "from": "2023-07-18 09:10:08",
    "to": "2023-07-18 21:26:52",
    "filters": [
        {
            "tag": "pg_instance",
            "value": "<your-hostname>@<your-connection-name>"
        }
    ],
    "by": "total_time",
    "limit": 10
}
As you can see, it includes various parameters such as time range, filters, sorting criteria, and the limit of the top queries we want to retrieve.
Notes:
- utc_time is set to false to make sure the timezone will depend on the timezone of the Datasentinel platform.
- You can set the time range to your desired time range. It should be your own database activity that you want to export your report from.
Finally, the value of the -o option is the name of the PDF file that you want to export. Once you run the above command, you’ll see the top-queries.pdf file is downloaded.
Putting it altogether in a bash script
Assuming you already have a database connection on your Datasentinel platform and have already set up the Datasentinel agent, here is a bash script to create the top queries PDF report:
#!/bin/bash

START_TIME=$1 # 2023-07-18 09:10:08
END_TIME=$2   # 2023-07-18 21:26:52

# Function to log messages with timestamps
log() {
    echo "[$(date +'%Y-%m-%d %H:%M:%S')] $1"
}

init() {
    export DATASENTINEL_TOKEN=<your-datasentinel-token>
    export CONNECTION_NAME=mydb
    export DATASENTINEL_PLATFORM_SERVER=https://<your-datasentinel-platform-host>
    export DATASENTINEL_USER=<your-datasentinel-username>
    export DATASENTINEL_PWD=<your-datasentinel-password>
    log "Starting the Datasentinel agent..."
    datasentinel start agent
}

check_server() {
    log "Checking the server information..."
    BASE_URL=https://localhost:8383
    curl -k -X GET $BASE_URL/api/server
}

generate_user_token() {
    curl -u $DATASENTINEL_USER:$DATASENTINEL_PWD \
         -k -X POST $DATASENTINEL_PLATFORM_SERVER/ds-api/user-token
}

get_user_token() {
    log "Getting the Datasentinel user token environment variable..."
    response=$(generate_user_token)

    # Extract the "user-token" value from the response using 'jq' (make sure you have jq installed)
    user_token=$(echo "$response" | jq -r '.["user-token"]')

    # Assign the "user-token" value to the DATASENTINEL_USER_TOKEN environment variable
    export DATASENTINEL_USER_TOKEN="$user_token"
}

check_user_token() {
    log "Checking the Datasentinel user token is created..."
    curl -u $DATASENTINEL_USER:$DATASENTINEL_PWD \
         -k -X GET $DATASENTINEL_PLATFORM_SERVER/ds-api/user-token?token=$DATASENTINEL_USER_TOKEN
}

download_top_queries_report() {
    log "Downloading the Top Queries report..."
    HOST=$(hostname)
    read -r -d '' report_json << EOF
{
    "utc_time": false,
    "from": "$START_TIME",
    "to": "$END_TIME",
    "filters": [
        {
            "tag": "pg_instance",
            "value": "$HOST@$CONNECTION_NAME"
        }
    ],
    "by": "total_time",
    "limit": 10
}
EOF
    echo "$report_json" > report.json
    curl -k --header "user-token: $DATASENTINEL_USER_TOKEN" \
         --header 'Content-Type: application/json' \
         --request POST "$DATASENTINEL_PLATFORM_SERVER/ds-api/activity/top-queries-report" \
         -d @report.json -o top-queries.pdf
}

init
check_server
get_user_token
check_user_token
download_top_queries_report
If you name this script create_report.sh, you can make it executable with the following chmod u+x create_report.sh.
Here is an example to create a report between the following two timestamps “2023-07-18 09:10:08” and “2023-07-18 21:26:52”:
./create_report.sh "2023-07-18 09:10:08" "2023-07-18 21:26:52"Before running the script, you need to sure that you have assigned the environment variables in the init function.
You’ll also need to install the jq tool (the command-line JSON processor) if you don’t have it already.