How to Analyze PostgreSQL Performance Report with ChatGPT API

How to Analyze PostgreSQL Performance Report with ChatGPT API
To enhance the process of analyzing PostgreSQL performance and driving optimization efforts, we can bring ChatGPT API to the scene and help us get more solutions to our insights.
We’ve seen how to integrate Datasentinel alerting feature with ChatGPT to give solutions to the database issues. Today, we will explore how we can leverage the ChatGPT API to analyze PostgreSQL reports.
We will gain valuable insights and contribute to the overall performance of PostgreSQL databases.
In this post, we’ll explore the Datasentinel’s Reporting API to get PostgreSQL reports. We will then integrate Datasentinel’s Workload API with ChatGPT API to get solutions for our PostgreSQL performance information.
We will start with the setup of the backend with FastAPI. We’ll then create API endpoints necessary for to get the top queries using the Reporting API and Workload API. Finally, we’ll integrate ChatGPT API to analyze the PostgreSQL insights that we have
Revisiting the Datasentinel integration with FastAPI
Before we integrate ChatGPT with the Datasentinel reporting API, we need to go through the previous tutorial to integrate Datasentinel with FastAPI. Once we go through the steps to build the backend using FastAPI, we’ll add more APIs to understand the Datasentinel reporting API endpoints and then move on to building the API method related to ChatGPT.
So check out the tutorial here and be sure add your own database connection.
API endpoints you’ll create
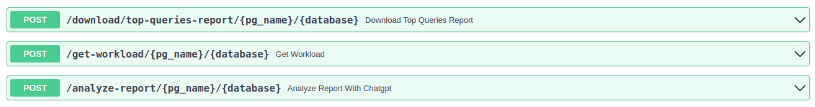
At the end of this tutorial, you’ll be able to build three APIs as shown below:
Before we create them, we need to check a few configurations regarding the Datasentinel platform.
Start Datasentinel agent
Once you’ve configured Datasentinel on your terminal following the FastAPI integration tutorial, you can start the agent by running the following command:
datasentinel start agentChecking the server information
We need to make sure that our Datasentinel platform is running by fetching its server name and port number. To do that, you can write the following API method in the main.py file:
@app.get("/get-server")
async def get_server():
    url = f"{base_url}/api/server"
    headers = {"api-token": datasentinel_token}
    response = requests.get(url, headers=headers, verify=False)
    content = json.loads(response.content)
    return JSONResponse(content)
The code above is a FastAPI method that retrieves server information from Datasentinel. It sends a GET request to the Datasentinel API endpoint /api/server using the provided base_url and datasentinel_token variables.
The response contains the hostname and port of the server like the following:
{
  "host": "<your-datasentinel-platform-server>",
  "port": 443
}
Datasentinel Reporting API
Now, we’re ready to communicate with the Reporting APIs after starting the datasentinel agent.
Generating the user token
We use the datasentinel token in the API methods that need authentication. To send requests to Reporting APIs, you need to use a user-specific token which expires one day after you generate it. This token is called a user token.
To generate this user token, you can write the following method:
from decouple import config


datasentinel_platform_server = "https://<your-datasentinel-platform-host>"
datasentinel_user = config("DATASENTINEL_USER")
datasentinel_pwd = config("DATASENTINEL_PWD")


@app.post("/generate-user-token")
async def generate_user_token():
    url = f"{datasentinel_platform_server}/ds-api/user-token"
    response = requests.post(
                    url,
                    auth=(datasentinel_user, datasentinel_pwd),
                    verify=False
                )
    content = json.loads(response.content)
    return JSONResponse(content)
The code above represents a FastAPI route that sends an HTTP POST request to generate a user token in Datasentinel. The route is defined with the @app.post("/generate-user-token") decorator, indicating that it handles POST requests to the /generate-user-token URL path.
Inside the function, the code constructs the URL for the POST request by combining datasentinel_platform_server and /ds-api/user-token. The datasentinel_platform_server variable represents the server address or base URL of the Datasentinel platform sent to you in the initial Datasentinel free trial email.
The requests.post() method is called with the constructed URL and additional parameters. The auth parameter is used to provide authentication credentials in the form of a tuple (datasentinel_user, datasentinel_pwd). This is used for basic authentication where datasentinel_user and datasentinel_pwd represent the username and password for the Datasentinel user. The verify=False parameter disables SSL verification, which should be handled properly in production environments.
To be able to run this endpoint via the localhost:8000/docs FastAPI endpoint, you need install the python-decouple library. So put it inside the requirements.txt file and install it with pip install -r requirements.txt.
You’ll also need to put the datasentinel username and password credentials in a .env file:
DATASENTINEL_USER=<your-datasentinel-username>
DATASENTINEL_PWD=<your-datasentinel-password>
You can find both credentials in the initial email that Datasentinel sent to you when you first signed up for the Datasentinel platform. Once you generate the user token, you can save it in another environment variable inside the .env file as follows:
DATASENTINEL_USER_TOKEN=<your-datasentinel-user-token>
You’ll need this token.
Important note: This token is different from the datasentinel token we used previously.
Checking the user token
You can display useful information about the user token using the following method:
@app.get("/display-user-token")
async def display_user_token(user_token):
    url = f"{datasentinel_platform_server}/ds-api/user-token?token={user_token}"
    response = requests.get(
                    url,
                    auth=(datasentinel_user, datasentinel_pwd),
                    verify=False
                )
    content = json.loads(response.content)
    return JSONResponse(content)
This function expects a user_token parameter, which represents the token associated with the user.
Inside the function, we construct the URL for the GET request by combining datasentinel_platform_server, /ds-api/user-token, and the query parameter token={user_token}.
The requests.get() method is called with the same parameters as the previous method.
The response contains a JSON like the following:
{
  "organization_name": "<organization-name>",
  "email": "contact@datasentinel.io",
  "user": "<user-name>",
  "expire_time": "2023-05-16 09:07:49"
}
As you can see, these parameters are related to your personal account on the Datasentinel platform including the expiration date of the user token. It turns out it expires one day after we generated it as mentioned above.
Benchmarking PostgreSQL performance with pgbench
To get insights from the report, we need to simulate some workload in a specific database. If you have a workload already in the database that you connected, you can skip this section.
We will use the pgbench tool which is a simple program to run benchmark tests on a PostgreSQL database. By default, it involves five SELECT, UPDATE, and INSERT commands per transaction.
To use this program, we will first create a new database:
sudo -u postgres psql -c "CREATE DATABASE plans;"And then initiate pgbench with the -i option and then the database that we’ve just created: (feel free to place a database other than plans)
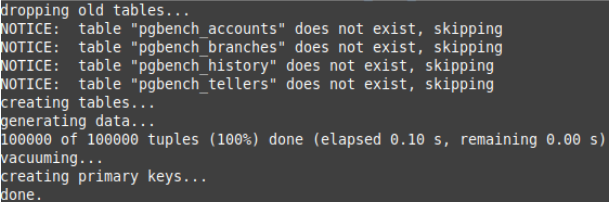
sudo -u postgres pgbench -i plansNow, invoking the initialization begins:
To run the pgbench program, you can use the pgbench command with the options as in the pgbench documentation:
sudo -u postgres pgbench -c10 -t300 plansIn this example, we’ve used the -c option with 10 to indicate that we need 10 clients to simulate running the queries which indicate the number of database sessions. Additionally, specifying the -t option with 300 value indicates that there are 300 transactions run by each client.
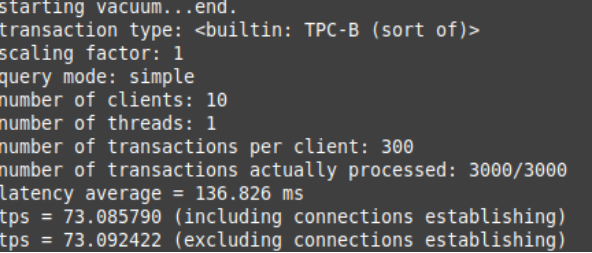
When you apply this pgbench command, you’ll see statistics like the following:
Downloading the Datasentinel report
By navigating through the Datasentinel Reporting API page, you’ll see different endpoints that you can send requests to. In this tutorial, we will send a request to the top queries endpoint.
Now, let’s create the following FastAPI endpoint (in the main.py script) to download reports:
from fastapi.responses import FileResponse
from utils import get_hostname


@app.post("/download/top-queries-report/{pg_name}/{database}")
async def download_top_queries_report(pg_name, database):
    hostname = get_hostname()
    pg_instance = f"{hostname}@{pg_name}"
    url = f"{datasentinel_platform_server}/ds-api/activity/top-queries-report"
    print(f"User token: {datasentinel_user_token}")
    headers = {"user-token": datasentinel_user_token}
    data = {
        "utc_time": False,
        "from": "2023-06-15 16:24:00",
        "to": "2023-06-15 16:33:00",
        "filters": [
            {
                "tag": "pg_instance",
                "value": pg_instance
            }
        ],
        "database": database,
        "by": "total_time",
        "limit": 10
    }

    response = requests.post(url, headers=headers, json=data, verify=False)
    with open("datasentinel_top_queries_report.pdf", "wb") as f:
        f.write(response.content)
    return FileResponse("datasentinel_top_queries_report.pdf", media_type="application/pdf", filename="datasentinel_top_queries_report.pdf")
This endpoint handles a POST request to the specified URL /download/top-queries-report/{pg_name}/{database}. The pg_name and database are FastAPI path parameters.
Inside the endpoint function, the hostname is retrieved using the get_hostname() function which is defined as follows in the utility script utils.py:
import socket


def get_hostname():
    return socket.gethostname()
The pg_instance variable is created by concatenating the hostname and pg_name.
The url variable is set to the API endpoint URL where the request will be sent to Datasentinel Reporting API. It is constructed using the datasentinel_platform_server variable and the following top queries report endpoint /ds-api/activity/top-queries-report. This is the part that you will change whenever you communicate with other Reporting APIs listed here.
The headers variable contains the request headers, with the user-token header set to the datasentinel_user_token variable value.
The data variable is a dictionary that represents the payload of the POST request. It includes various parameters such as time range, filters, database name, sorting criteria, and limit of the top queries we want to retrieve.
Notes:
- utc_time is set to False to make sure the timezone will depend on the timezone of the Datasentinel platform.
- You can set the time range to your desired time range. It should be your own database activity that you want for the exported report.
The request is sent using the requests.post() function, passing the URL, headers, JSON data, and verify=False to disable SSL verification (for debugging purposes).
The response content, which is the PDF file, is saved to a file named datasentinel_top_queries_report.pdf using a binary write mode.
Finally, a FastAPI FileResponse object is returned with the saved file. It specifies the media type as application/pdf and provides the filename as datasentinel_top_queries_report.pdf. This allows the file to be downloaded by the client as a PDF as you can see in the download link below:
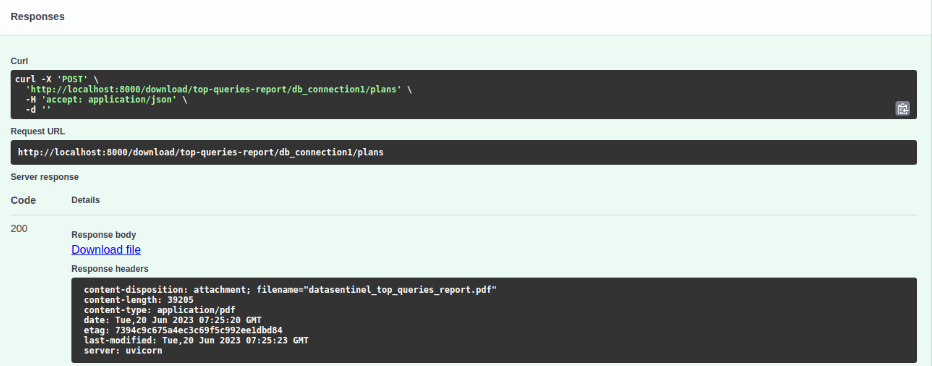
To see this button, you need to execute the download top queries endpoint. Here is the automated Swagger documentation for this endpoint:
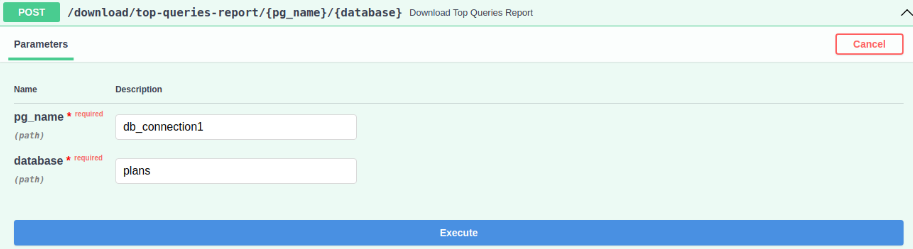
Once you hit the download button, you’ll receive a PDF file similar to this Datasentinel top queries sample report. Datasentinel top queries sample report
Datasentinel Workload API
You can also retrieve the same results of your database’s top queries in a different format, in JSON or CSV, by sending a request to the Workload API.
In this tutorial, we will see how to send a request to the top queries API. Let’s create a FastAPI method for that:
@app.post("/get-workload/{pg_name}/{database}")
async def get_workload(pg_name, database):
    hostname = get_hostname()
    pg_instance = f"{hostname}@{pg_name}"
    url = f"{datasentinel_platform_server}/ds-api/activity/top-queries"
    headers = {"user-token": datasentinel_user_token}
    data = {
        "utc_time": False,
        "from": "2023-06-15 16:24:00",
        "to": "2023-06-15 16:33:00",
        "filters": [
            {
                "tag": "pg_instance",
                "value": pg_instance
            }
        ],
        "database": database,
        "by": "total_time",
        "limit": 10
    }

    response = requests.post(url, headers=headers, json=data, verify=False)
    content = json.loads(response.content)
    return JSONResponse(content)
This endpoint is similar to the reporting endpoint we discussed previosuly except the following:
- The endpoint we send to Datasentinel is as follows: {datasentinel_platform_server}/ds-api/activity/top-queries
- By default the output of the Workload is in JSON. If you want to set it to CSV, you can specify the output parameter in the payload (the data dictionary) to be csv.
- The output of the FastAPI method is a JSON response.
This workload method looks like the following in the Swagger documentation:
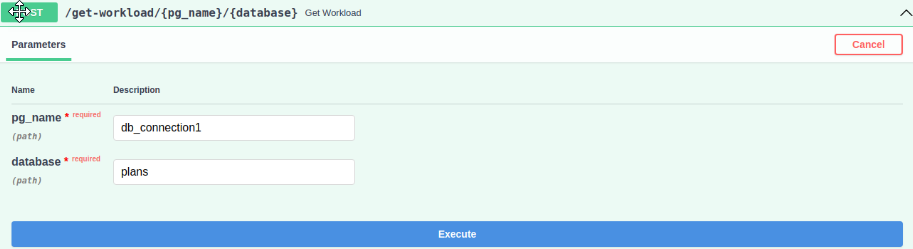
When you hit the execute button, you’ll get a JSON response like the following:
[
  {
    "pg_instance": "<hostname>@db_connection1",
    "database": "plans",
    "user": "postgres",
    "query_md5_id": "<hash-query-id>",
    "queryid": "<query-id>",
    "calls": 21030,
    "local_blks_dirtied": 0,
    "local_blks_hit": 0,
    "local_blks_read": 0,
    "local_blks_written": 0,
    "rows": 21030,
    "shared_blks_dirtied": 10,
    "shared_blks_hit": 396615,
    "shared_blks_read": 0,
    "shared_blks_written": 2,
    "temp_blks_read": 0,
    "temp_blks_written": 0,
    "total_time": 2125530,
    "blk_read_time": 0,
    "blk_write_time": 0,
    "wal_bytes": 0,
    "min_time": 0,
    "max_time": 0,
    "time_per_call": 0,
    "text": "UPDATE pgbench_branches SET bbalance = bbalance + $1 WHERE bid = $2"
  },
  {
    "pg_instance": "<hostname>@db_connection1",
    "database": "plans",
    "user": "postgres",
    "query_md5_id": "<hash-query-id>",
    "queryid": "<query-id>",
    "calls": 21021,
    "local_blks_dirtied": 0,
    "local_blks_hit": 0,
    "local_blks_read": 0,
    "local_blks_written": 0,
    "rows": 21021,
    "shared_blks_dirtied": 3467,
    "shared_blks_hit": 90350,
    "shared_blks_read": 0,
    "shared_blks_written": 29,
    "temp_blks_read": 0,
    "temp_blks_written": 0,
    "total_time": 1662,
    "blk_read_time": 0,
    "blk_write_time": 0,
    "wal_bytes": 0,
    "min_time": 0,
    "max_time": 0,
    "time_per_call": 0,
    "text": "UPDATE pgbench_accounts SET abalance = abalance + $1 WHERE aid = $2"
  },
  ...
]
High number of calls and total time for ‘UPDATE pgbench_branches SET bbalance = bbalance + $1 WHERE bid = $2’ query:
- This query has a high number of calls (21030) and total time (2125530), which could indicate that it is being executed frequently and taking a long time to complete.
- One potential solution is to optimize the query by adding an index on the ‘bid’ column in the ‘pgbench_branches’ table, which could improve query performance and reduce the number of calls and total time.
As you can see, it lists all top queries related to the plans database restricted by the limit you set.
Integrating ChatGPT with the Datasentinal Reporting API
To leverage the power of ChatGPT in generating smart database reports for Datasentinel, you can build upon the previous API method and make the analyze_report_with_chatgpt() function as follows:
from utils import ask_chatgpt


@app.post("/analyze-report/{pg_name}/{database}")
async def analyze_report_with_chatgpt(pg_name, database):
    hostname = get_hostname()
    pg_instance = f"{hostname}@{pg_name}"
    url = f"{datasentinel_platform_server}/ds-api/activity/top-queries"
    headers = {"user-token": datasentinel_user_token}
    data = {
        "utc_time": False,
        "from": "2023-06-15 16:24:00",
        "to": "2023-06-15 16:33:00",
        "filters": [
            {
                "tag": "pg_instance",
                "value": pg_instance
            }
        ],
        "database": database,
        "by": "total_time",
        "limit": 10
    }

    response = requests.post(url, headers=headers, json=data, verify=False)
    content = json.loads(response.content)

    print("Sending the database report to ChatGPT...")
    system_prompt = "You're a PostgreSQL database expert."
    user_prompt = f"""
    {content}
    ---

    Provided above is a postgresql report for my database called '{database}'.
    Please give me solutions on how to fix any database issue you found, if any. Give me the answer in the following format:

    [Query, exclude DDL commands]
    [Diagnosis, stating total time and any relevant metric]
    [Solution if any]
    """

    report_solutions = ask_chatgpt(user_message=user_prompt, system_message=system_prompt)
    print(f"Given the insights from the report, here are solutions provided by the AI:\n\n{report_solutions}")
    return report_solutions
As you can see, we send a request to the same Workload Top Queries API to get a JSON response. This response is then sent to the user_prompt, one of the arguments of ask_chatgpt function that we import from the utility script.
The return of the /analyze-report/{pg_name}/{database} endpoint is the report solutions received by ChatGPT.
Here is the ask_chatgpt logic inside the utils.py script:
import openai
from decouple import config


def ask_chatgpt(user_message, system_message):
    # Set up the OpenAI API client
    openai.api_key = config("OPENAI_API_KEY")
    # Call the OpenAI API to generate the solution to the issues in the report with ChatGPT
    messages = [{"role": "user", "content": user_message}]
    messages.append({"role": "system", "content": system_message})
    response = openai.ChatCompletion.create(
        model="gpt-3.5-turbo",
        messages=messages,
        max_tokens=500,
        temperature=0.5
        )

    # Returns the generated text
    return response.choices[0].message.content
We start by setting up the OpenAI API client. To configure that, you need to store the OPENAI_API_KEY in a .env file as follows:
OPENAI_API_KEY=<your-openai-api-key>
We then call the OpenAI API to generate the solution to the database issues found in the workload JSON.
The function takes a user_message and a system_message as inputs. A list named messages is created, which contains two dictionaries representing the user message and system message. The user message is assigned the “user” role, and the system message is assigned the “system” role.
The openai.ChatCompletion.create() method is called to generate the response. It takes the following parameters:
- model: The model to use for generation, which in this case is “gpt-3.5-turbo”.
- messages: The list of messages to provide as context for the conversation.
- max_tokens: The maximum number of tokens in the generated response. If you think the report solutions can exceed this limit, you can increase this value.
- temperature: The temperature value that controls the randomness of the generated response.
The API call returns a response object, from which the generated text can be extracted using response.choices[0].message.content.
Now, you can try out the workload ChatGPT endpoint and hit Execute:
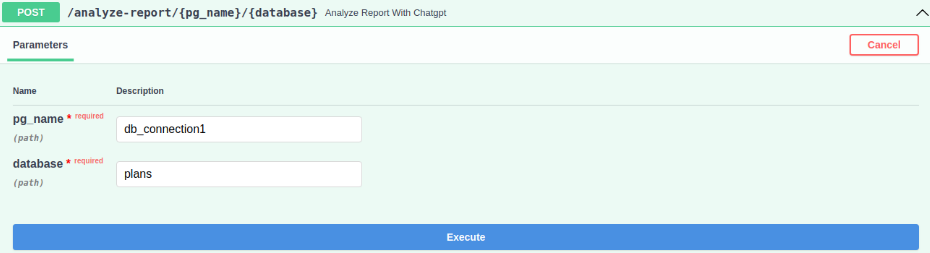
You’ll end up with a solution similar to the following:
Great! Let me take a look at the report.

First, let me clarify that the report provides information on several queries, some of which are DDL commands and not actual queries. For the purpose of this exercise, I will focus on the actual queries.

Query 1:
UPDATE pgbench_branches SET bbalance = bbalance + $1 WHERE bid = $2

Diagnosis:
This query has been called 21030 times and has a total time of 2125530. It has not read or written any blocks locally, but has dirtied 10 shared blocks and hit 396615 shared blocks. It has also written 2 shared blocks.

Solution:
This query seems to be updating a table called 'pgbench_branches'. Depending on the size of this table and the frequency of updates, it may be worth considering optimizing the table and/or indexes to improve performance. Another option could be to batch the updates instead of performing them one by one.

Query 2:
UPDATE pgbench_accounts SET abalance = abalance + $1 WHERE aid = $2

Diagnosis:
This query has been called 21021 times and has a total time of 1662. It has not read or written any blocks locally, but has dirtied 3467 shared blocks and hit 90350 shared blocks. It has also written 29 shared blocks.

Solution:
This query seems to be updating a table called 'pgbench_accounts'. Depending on the size of this table and the frequency of updates, it may be worth considering optimizing the table and/or indexes to improve performance. Another option could be to batch the updates instead of performing them one by one.

Query 3:
SELECT pg_roles.rolname AS tag_user, ltrim(to_char(planid, $1)) AS tag_planid, ltrim(to_char(queryid_stat_statements, $2)) AS queryid_stat_statements, pg_database.datname AS tag_database, calls, total_time, rows, shared_blks_hit, shared_blks_dirtied, shared_blks_read, shared_blks_written, local_blks_hit, local_blks_dirtied, local_blks_read, local_blks_written, temp_blks_read, temp_blks_written, blk_read_time, blk_write_time, to_char(last_call, $3) AS last_call FROM pg_store_plans, pg_database, pg_roles WHERE pg_store_plans.queryid_stat_statements != $4 AND pg_store_plans.dbid = pg_database.oid AND pg_store_plans.userid = pg_roles.oid AND (calls >= $5 OR total_time >= $6)

Diagnosis:
The query has been executed 10 times, taking a total of 119 milliseconds. It didn't perform any local or shared block operations. It fetched 1,574 shared blocks. The total time per call is not provided.

Solution:
This query appears to be a diagnostic query fetching data from system tables. No significant performance issues are evident from the provided information.

Please note that the given report lacks specific performance metrics like execution plans, indexes, and server configurations. To provide more precise solutions, additional details regarding database schema, workload characteristics, and system configuration would be helpful.
This is a trimmed version of the actual ChatGPT response to give you a sense of how ChatGPT can spot database issues from your report.
We’re just scratching the surface.
You can go deeper and edit the prompt for your own case based on your own database situation.